Flot and chaos
Recently I started re-reading a book by now Professor, Ian Stewart, called “Does God play dice?”. A truly fascinating book about how the universe isn’t always predictable. It all comes down to Chaos Theory.
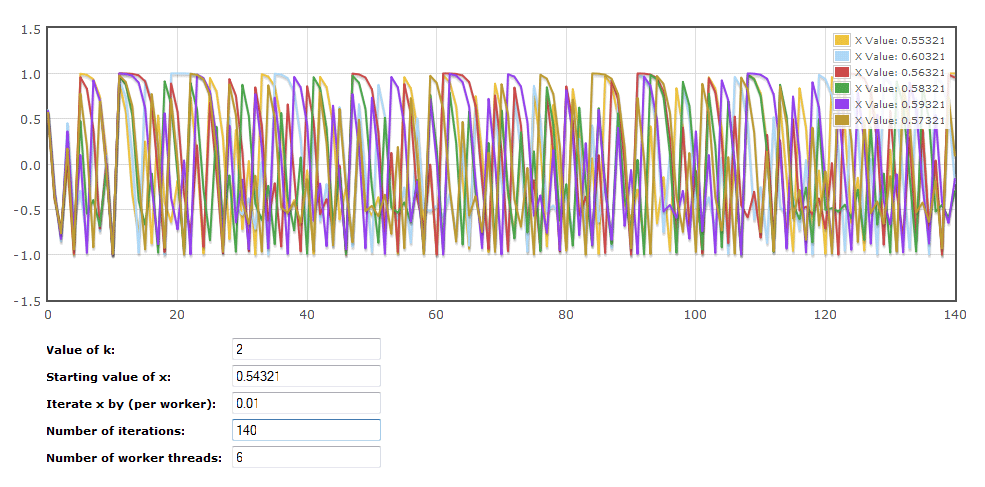
In the first chapter page 14 & 15 the reader is invited to grab a calculator and create a little chaos. With a few key presses it’s possible to create a completely chaotic pattern of numbers. Ian Stewart has also added a little graph to show what that pattern looks like; this is where Flot comes in.
Flot is an pure JavaScript graphing engine for jQuery. It can create great looking graphs in a matter of minutes. Pass your data in an array to Flot, it does all the hard work and a graph pops out the other end using the HTML5 canvas tag with some VML magic. It is even supported by IE, just add a conditional tag with a script tag pointing to excanvas.pack.js.

The equation to create this set of chaotic data is very simple:
1
x = k*(x*x)-1;
As you can see from the formula above, the equation is a feedback loop. With each iteration a new value of ‘x’ is created and fed back in. The amazing thing about this equation is how simple it is to get both order and chaos. Set your value of ‘k’ to 1 and after a few iterations order is achieved; set ‘k’ to 2 and you get chaos.
I will be posting a demo to play with in the next few days, it isn’t quite finished yet but you can see a screenshot above.
