How to read a WebPageTest Connection View chart
Table of contents
- Intro
- Basic Layout
- Connection negotiation and vertical lines
- Horizontal timings
- Using the 'Waterfall View' and 'Connection View' together
- Common scenarios
- Conclusion
Disclaimer
This article is the sister post to my 'How to read a WebPageTest waterfall chart', so if you are interested in the 'Waterfall View' chart, then check out that article too. Note that reading it isn't mandatory. I have written this post to be fairly independent of the first, and will cross link relevant sections where required. If you do happen to read both, there could be some repeated information (sorry about that).
Intro
When you run a test using WebPageTest the Connection View is the waterfall chart directly below the main Waterfall View that everyone knows and loves. It's often underused, but the Connection View offers insights that are not easily seen in the main Waterfall View so it really shouldn't be ignored. Once you understand what it is displaying it's an incredibly powerful tool, allowing you to quickly identify many web performance issues simply by looking at the connections a browser makes to the server. Read on to find out more.
Basic Layout
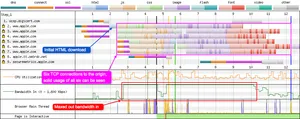
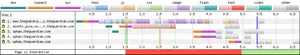
Here's the basic layout of the connection view user interface:
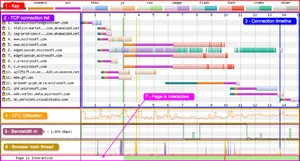
1 - Key
The key shows two types of information:
- Information about the connection status (DNS lookup, connection established, SSL negotiation)
- The type of resource being requested (e.g. HTML, images etc)
Each resource has 2 colours, a light shade and a dark shade. The light shade signifies the point at which the browser has made the request for the resource. The dark shade is the point at which the resource is actually downloading. See this comment from Pat Meenan for more information. Pat's response is also quoted below:
The lighter time is the time from when the browser sends the request out on the wire until the first byte comes back. The darker color is the period where the resource is actually downloading.
Looks like the production site is using HTTP/2 and the dev site is not which is why you see radically different request behavior.
With http/2 the browser can issue all of the requests to the server in one go and the server will send them back in the order the browser prioritized them (mostly).
with the dev server, the browser can only make 6 requests at a time and has to wait for each to complete before issuing more.
Generally, all else being equal, HTTP/2 will perform better so it is going to be hard to compare your dev work to the production system without having the same serving architecture.
Note: The Connection View doesn't show request 'wait time' or 'JS Execution' like the Waterfall View does. It simply isn't possible to visualise these on this view since asset requests stack horizontally. See 'Request 4 - Static assets' for more details on this.
2 - TCP connection list
This displays a list of individual TCP connections that the browser negotiated while loading the page, and the order in which they were opened. The first request is usually the request for the page HTML, unless an OCSP check is required. Note the yellow closed padlock icon to the far left of the row. This tells you the TCP connection is secure (HTTPS).
3 - Connection timeline
The timeline shows time along the x-axis (horizontal) vs the individual TCP connection on the y-axis (vertical). Each row shows a TCP connection being opened (DNS + Connect + SSL), and then the individual asset requests that were downloaded using this TCP connection. By examining the key (1), it is possible to easily identify the type of file that was downloaded on the connection (the multi-coloured banding).
4 - CPU Utilisation
A simple graph showing the CPU utilisation of the browser process running on the device. It displays how much CPU the current webpage is using at any point in time. It ranges from 0 - 100% utilisation. See this comment from Pat Meenan for more information. The quote of what Pat said is below too:
The CPU utilization line is the CPU utilization of just the browser process that is running the test (same as you would see in task manager) on a fixed scale from 0-100% (sampled in 0.1 sec intervals).
There are lots of things that cause the CPU utilization to spike but javascript is a very common contributor (particularly if there are gaps in the waterfall where the CPU is pegged at 100% - telltale sine of javascript that needs optimizing). The CPU will also get exercised as the browser figures out how to layout the page and apply styles and finally, the testing itself can also introduce some spikes (really short spikes when the screen shots are taken for example). If you capture a video then the impact of recording the screen shots will be higher.
Usually if I see something that looks suspicious I'll load it up into Dynatrace Ajax Edition (great free profiler for IE) and run the page through to see if anything jumps out. I'd love to integrate the capture of the profiling data at some point in the future.
Even though it wouldn't really impact the numbers, right now only one test is ever executing on a given machine at a time. We can (and have) run configurations with multiple tests at the same time but when video capture was introduced it killed our ability to run in parallel. I'm experimenting with running the tests in VM's to see if I can get more testing capacity out of the hardware because the machines are pretty beefy and could easily handle 8+ tests in parallel but I won't do it if it introduces any variability into the results.
5 - Bandwidth In
This is an indicator of when data is coming into the browser. The visualisation is helpful to see when the browser is doing useful work vs wasted time. The absolute scale can be ignored, as it isn't very accurate. Use the 'Capture network packet trace (tcpdump)' option in the advanced tab on the WebPageTest homepage if you want more accurate results. You will also need to enable this feature if you want to see the chart on mobile devices. See this comment from Pat Meenan for more information. I've quoted what Pat said below:
The bandwidth graph is more just an indicator of when data is coming in. I've debated removing it but it is helpful to see when the page is actually downloading stuff (useful work) and when it's not (wasted time). This can help a fair bit when you flush the document early to see the initial chunk of data coming in and to make sure that data continues to come in from then on.
Don't pay too much attention to the absolute scale because the raw measurements will not be very accurate (just by definition in how things are measured from the client side).
6 - Browser Main Thread
This graph visualises what the browsers main thread is doing at any specific point in time (x-axis). The y-axis shows the percentage from 0 - 100%. The colours were copied from the Chrome DevTools CPU graph (under the performance tab). Here's what each of the colours mean:
- Orange - Script parsing, evaluation and execution
- Purple - Layout
- Green - Painting
- Blue - HTML parsing
Using this graph it is possible to see if the CPU is becoming a bottleneck in one of the above areas.
7 - Page is Interactive
This graph gives you an indication of when the main thread is blocked. The red blocks indicate that the main thread has been blocked for 100ms (which will also block inputs like button presses). Green indicates the thread isn't blocked. Note: it still may be possible to scroll during red blocked phases, as scrolling is usually handled off the main thread for most browsers. See this comment from Pat Meenan for more information. I've quoted Pats reply below:
Scrolling will generally be fine since it is usually handled off-thread for most browsers as long as there are no active scroll events attached. Clicking should be delayed but not necessarily for the full duration of the red (though the first one looks like a single executing JS function so it would be for the full duration of that block).
The red blocks are any point where the main thread is blocked (including from input) for 100ms. A lot of separate 100ms events can make it look like a long block or a single really long event can also show up (which could be a way worse experience).
How did you measure being able to click on a link during one of the red blocks? You'd have to have a test machine handy with a similar CPU and connectivity and then try to click in the UI immediately after it starts to render.
Connection negotiation and vertical lines
Just under the Connection View header, you can see a key with each stage in a connection negotiation and the coloured vertical lines (example below):

But what do each of them mean?
Domain Name System (DNS) Lookup - Turquoise line
The browser wants to convert a domain name into a server IP address. It first checks its cache for the DNS record, if not found it will contact a DNS server for the correct IP address. The turquoise line you see is the time taken for this request to happen.
Initial Connection - Orange line
This is where the browser negotiates a TCP connection with the server (located at the IP address found via the DNS lookup above). There's a whole lot more than that goes on behind the scenes that I won't cover here. Check out the 'Building Blocks of TCP' chapter in 'High Performance Browser Networking (HPBN)' by Ilya Grigorik if you want to know (lots) more.
SSL Negotiation - Magenta line
If the website is using a secure connection (HTTPS), the final stage of the connection negotiation is the TLS handshake. The browser and server agree on the TLS protocol version, the ciphersuite to use and verify certificates. Only once this encrypted tunnel is negotiated can the browser and server start to exchange data related to the web page itself. Again, if you wish to know more check out the chapter 'Transport Layer Security (TLS)' in HPBN.
Start Render - Green line
This is the first point at which a user will see pixels painted to the screen. The pixels could be from anything at all (background colours, borders etc), not necessarily content. Before this point the screen was blank. This metric is measured by analysing individual video frames that are captured during the page load. See comment from Pat Meenan for more information. I've quoted Pat's reply below:
Start render is measured by capturing video of the page load and looking at each frame for the first time the browser displays something other than a blank page. It can only be measured in a lab and is generally the most accurate measurement for it.
msFirstPaint is a measurement reported by the browser itself about when it thinks it painted the first content. It is available from javascript and can be reported from the field. It is usually pretty accurate but sometimes it reports the time when the browser painted nothing but a blank screen.
DOM Content Loaded - Pink line
The point at which the HTML has been loaded and parsed, and the browser has reached the end of the document. All blocking scripts have been loaded and run. The DOM at this point is completely defined. See comment from Pat Meenan for more information. I've quoted what Pat replied below:
Usually Visually Complete WILL happen before Document Complete. Document Complete is the onload event which fires when all of the scripts, css and images defined in the HTML have finished loading (including below-the-fold content).
domContentLoaded is a technical event the browser fires when it has finished parsing the HTML and reached the end of the document (which means it has loaded and run run all blocking scripts as well). At that point the "DOM" (all of the elements in the document) is completely defined. The event shows up as a vertical pink bar in the waterfall.
There is a lot of non-blocking content that will still need to load that can radically impact the visual experience though (images and fonts in particular).
Visually Complete is measured from a video capture of the viewport loading and is the point when the visible part of the page first reached 100% "completeness" compared to the end state of the test.
Visually Complete can happen before domContentLoaded when the browser is busy parsing and executing things that aren't visible at the top of the page. A likely cause is blocking scripts at the end of the document. They don't visually impact what the user sees in the viewport but the parser can't reach the end of the document and fire DCL until it finishes downloading and running them.
On Load - Lavender line
The point at which the window load event fires. All objects are in the DOM and all images and scripts have finished loading.
Document Complete - Blue line
The point where the onload event has fired and all the static image content has loaded. Content changes that are triggered by JavaScript execution may not be included.
Horizontal timings
Let's now take a look at the panel with all the interesting details, the Connection timeline. As mentioned earlier, it looks quite similar to the Waterfall View, only in this view each row is a TCP connection. The coloured bands you see (sometimes multiple types), are individual assets being downloaded in succession.
Lets now examine a few of the TCP connections from this connection view to explain what is actually happening.
Note: When looking at the Connection View it is worth keeping in mind that it doesn't give an indication of the number of bytes being downloaded over a specific time period. So it may look like two connections are doing the same amount of work. For example, one connection could be downloading 10MB in 1 seconds, and another 1KB in 1 second and it will look like they are doing the same amount of work. This is one of the limitations of the connection view.
Request 1 - The HTML
Request one is a simple one. It looks exactly the same as it would in the Waterfall View. It gives you a visualisation of the time taken to negotiate the connection and how long from the HTML request to when it completed. The whole row is dedicated to that single origin domain, so if there were more assets downloaded from it they would show on the same row.
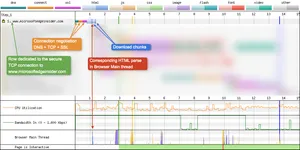
Notice how after the first download chunk of HTML (the first dark band), this triggers HTML parsing on the browsers main thread. This is an example of HTML early flush
Note: The reason the other requests are blurred is purely so it's easier for the reader to focus on a single request, not because it contains sensitive information. Unfortunately there is no way to filter and show only selected requests when you customise the Connection View waterfall chart. Possible feature request Pat Meenan? :)
Request 4 - Static assets
Request 4 triggers another TCP connection negotiation since the static assets aren't on the origin (it therefore gets a dedicated row). We also see the first example of multiple asset types being downloaded on the connection, and the vertical coloured banding this creates. Examining the key we can see that CSS is being downloaded, as well as JavaScript (both requested and downloaded).
Notice how even though the JavaScript is downloaded, actual JS Execution isn't visualised on the connection view like it is on the waterfall view:
You can verify the execution is actually taking place in the Connection View by looking at the Browser Main Thread graph at the bottom of the UI (yellow spikes). Visualisation of the JS execution isn't possible on the Connection View due to the way assets can overlap when being downloaded. It is therefore better to refer to the Waterfall View when examining JS Execution.
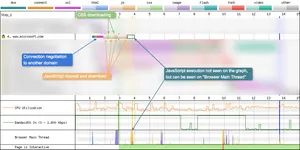
Request 5 - Fonts
For HTTP/1.1 you could have 6 credentialed connections and 6 anonymous connections to the same domain, and with HTTP/2 you may typically see 1 or 2 connections. Here's where the connection view is a really powerful tool: visualising multiple TCP connections to the same domain. Looking at this from the Waterfall View you may assume that all assets coming from the same domain use the same TCP connection. With the Connection View it is easy to see that isn't the case:
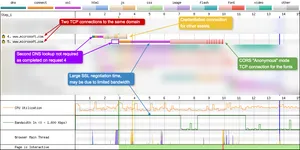
You may be wondering why there are two connections to the same domain when one of them isn't being used, but this is due to how the fetch specifications work. Same origin requests can still redirect to a cross-origin one, which would result in different requests depending on the credentials mode. So whenever you preload a web font, always include the crossorigin attribute (even when serving the font from the same domain). If you don't the font will be downloaded twice (once on a credentialed connection that can't be used, then again on an anonymous connection to be used).
Request 4 downloads the static assets (as seen in the previous section), request 5 is a TCP connection dedicated to anonymous mode assets (in this case only the fonts). Notice how request 5 doesn't require a DNS lookup, since this already happened in request 4. It's also very interesting to see the difference in SSL negotiation time to the same domain. This could be due to bandwidth limitations on the device now that other TCP connections are using it. But you'd usually expect the SSL time to be shorter due to TLS session resumption when re-establishing a connection shortly after another one.
Request 10 - Download "pause"
Here's another connection opened to download JavaScript assets, but what is interesting about request 10 is the fact that there is a gap between the horizontal blocks:
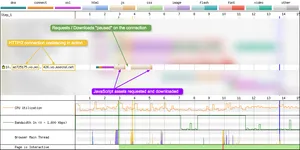
In fact, this is because two separate JavaScript files are being downloaded. Now, this could be due to the way these asset requests are being scheduled for download. The browser simply requests one first, then at a later time (perhaps after executing this first JavaScript?) it makes another request for some more JavaScript across the same connection.
But there's something even more interesting happening here that may not be obvious. Here is an example of HTTP/2 connection coalescing in action. The following domains share similar properties like certificate, IP address etc. Under these conditions the browser realises it doesn't need to open a new TCP connection, it can simply use the one already open. So two subdomains are now associated with a single TCP connection. In this case:
az725175.vo.msecnd.netaz416426.vo.msecnd.net
It's difficult to see this coalescing on a standard Waterfall View, but on the Connection View it's much more obvious. See 'HTTP/2 Coalescing' scenario later in the post.
Summary
And here you can see the Connection View we've been examining in all its glory:
As you can see there are 15 rows, meaning there are 15 TCP connections created in the loading of this website. Each of these connections had some form of DNS, TCP, SSL negotiation involved, which is expensive in terms of time and can affect web performance. The Connection View is a great way to see very quickly how many connections there are and how each of them is being used. Using it in conjunction with the Waterfall View will allow you to identify potential performance issues quickly, that using the Waterfall View on its own would be difficult to see.
Using the 'Waterfall View' and 'Connection View' together
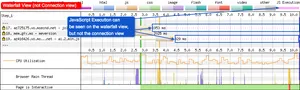
One point that is worth talking about is how each view relates to each other. It may look like they are two separate views that are unrelated, but that's not true:
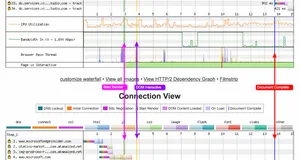
All three lines identified in screenshot all line up perfectly. This isn't just a lucky coincidence, this is intentional. Both views are using the same timescale, therefore if you see a request in the Waterfall View that you'd like to know about the connection information, simply scroll down the page and you will find it in the same place on the Connection View. The Connection View adds a whole new dimension to the traditional WebPageTest waterfall chart.
Common scenarios
Here's a list of common patterns seen in the WebPageTest Connection View. I'll add more of these over time as I encounter them.
HTTP/2 Coalescing
Under HTTP/1.1 a browser would typically open six TCP connections to a single domain, thus allowing six assets to be downloaded from that domain at any one time. HTTP/2 changed this by adding multiplex streaming of files over a single TCP connection. HTTP/2 Coalescing is quite a complex topic, but a quick TL;DR is: if a domain and sub-domain share similar properties, the browser does not need to open a second connection; it may reuse the first. All content from coalesced domains can be transferred over the single shared connection. It's difficult to spot this coalescing happening on the Waterfall View, but in the Connection View it is relatively simple to spot:
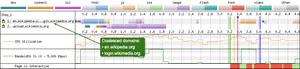
This is a really simple example of coalescing. Here en.wikipedia.org, login.wikimedia.org is coalescing and using the same TCP connection (connection 1). Due to the use of ellipses for long domain strings, when this occurs it can be quite difficult to tell exactly what domains are being coalesced. But if you do happen to see '...' in the domain listings, there's a chance coalescing could be occurring.
I'd love to see an additional icon next to the SSL lock icon to identify when coalescing is occurring in the Connection View, just to make it really obvious... just an idea if you happen to be reading Pat :)
HTTP/1.1 vs HTTP/2
This isn't a straight forward scenario to answer, as it completely relies on how the website has been setup in terms of sub-domains and third parties. I can't cover all eventualities but I can hopefully give you a general idea of the difference you see on the connection graph. Lets run a test on the same domain, once with HTTP/2, the other with HTTP/1.1 (via the --disable-http2 Chrome flag). For this example I've chosen to examine the BBC News website using both protocols:
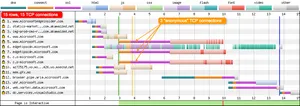
HTTP/1.1 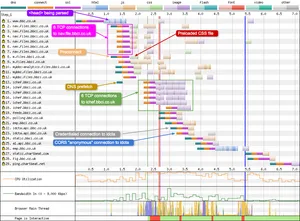
This is a fairly busy connection chart, with a total of 29 TCP connections required to load the page. The dns-prefetch and preconnect that are in the <head> tag can be seen on connection 8 and 13. You can also see the browser creating 12 connections to just two domains (nav.files.bbci.co.uk, ichef.bbci.co.uk, 6 each, 2-7 & 13-18). This is an example of HTTP/1.1 domain sharding in action. With TCP connections 22 & 23 you can see an example of credentialed vs non-credentialed TCP connections. Connections 1 - 12 show some connection reuse, but not much. I'll talk about this more in the 'Underutilised connections' section.
HTTP/2 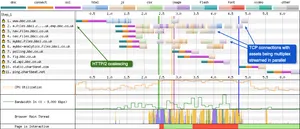
Compared to the HTTP/1.1 connection graph, HTTP/2 is a lot simpler. There are only 11 TCP connections compared to 29, so where have these connections gone? A large number have been removed because the browser is no longer opening 12 connections for only two domains (nav.files.bbci.co.uk, ichef.bbci.co.uk). The other reason for the reduction of connections is due to HTTP/2 connection coalescing, as discussed earlier. The BBC News website is actually doing this really efficiently, with 5 domains being coalesced in request 2:
m.files.bbci.co.ukemp.bbc.co.ukichef.bbci.co.ukstatic.bbci.co.ukidcta.api.bbc.co.uk
As you can see in request 2, because of coalescing this single TCP connection is doing a huge chunk of work. It is downloading JavaScript, CSS, images, and JSON (other). The same can be seen in request number 3, another busy TCP connection that is streaming multiple assets. While we're on the topic, I'm curious to find out why nav.files.bbci.co.uk isn't actually being coalesced into request 2. It is coming from the same IP address, but maybe the certificate is different. Maybe an engineer from the BBC can investigate and let me know.
As you can see with HTTP/2, if setup correctly it can reduce the number of TCP connections quite dramatically, thus allowing multiple assets to be streamed over a single connection. This allows for better prioritisation and more efficient use of the bandwidth available. This is especially important considering HTTP/2 is built upon TCP, and these are subject to TCP slow start. So the more a single TCP connection is used, the quicker it will become (assuming a stable connection with minimal congestion).
Underutilised connections
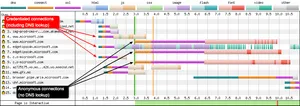
A really great use of the Connection View is to identify how connections that the browser has opened are being utilised. After all, it takes time and resources to open a TCP connection, so you want to make sure each is being used efficiently. So let's turn our attention to a site I know quite well, GOV.UK, and see if we are using our TCP connections efficiently (tested on Chrome - 3G - HTTP/1.1):
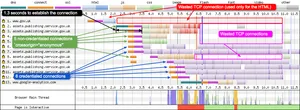
Looking at each connection (row) you can see how each is being utilised. A row filled with colour is being utilised a lot more than one that is empty.
Request number 1 for example it only being used for the initial HTML download, it is never used again. Request 2-5 and 8 are CORS crossorigin='anonymous' connections, so are only used for assets that require no credentials. Six of these are created for CSS, JS, and fonts, but once all these assets are downloaded they aren't used again. Request 6,7, 9-12 are credentialed connections on which all the images are downloaded. Here we see the reverse of crossorigin='anonymous' connections above. Request 6,7, 9-12 are opened late (wasted time at the start of the waterfall), then they are heavily utilised later.
With HTTP/1.1 we want to be aiming for a connection graph that fully utilises all open connections across the whole width. For example the Apple website does a good job of utilising all connections under HTTP/1.1:
Here we see six TCP connections to the origin, all of which are heavily utilised by the browser (Chrome on 4G). There's no need for an additional domain shard in this instance (and therefore another 6 TCP connections), as the first 6 are already maxing out the bandwidth available for a large percentage of the total page load time.
CORS 'anonymous' connections
I've mentioned anonymous (non-credentialed) connections in this post earlier but haven't really explained what that actually means. The value of anonymous means that there will be no exchange of user credentials via cookies, client-side SSL certificates or HTTP authentication across the connection, unless on the same origin. You can find much more information about this in the Cross-Origin Resource Sharing (CORS) specification.
CORS is particularly important when you come to using web fonts on your website, since the font-face specification requires that fonts served from a different domain than the origin are loaded in "anonymous mode". It is easy to spot non-credentialed connections on the Connection View since many websites may only use them for font loading (but not always!). So if you see a font loading from a different domain that is on a separate TCP connection, it will be crossorigin='anonymous'.
In the Connection View example above we can see three TCP connections (requests 5, 7, 9) setup purely to download the fonts the page requires. We can confirm that the browser has already seen these domains since there's no DNS lookup needed for these connections (turquoise line). If you'd like to confirm that these connections are indeed using CORS, simply scroll up and find the same request in the Waterfall View. Clicking on the request, under the 'Request' tab you will see either sec-fetch-mode: no-cors for non-CORS connections, or sec-fetch-mode: cors for CORS connections.
OCSP
Online Certificate Status Protocol (OCSP) is an internet protocol used for obtaining the revocation status of a digital certificate. In some situations a browser will send a request to an OCSP responder to see if a sites certificate has been revoked. Chrome doesn't do it for Domain Validation (DV) and Organisation Validation (OV) certificates, but it does do it for Extended Validation (EV) certificates. Where as Internet Explorer does it for both.
This can quite clearly be seen in the Connection View as it will be the very first connection in the chart (even before the HTML request):
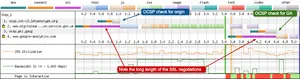
There are two OCSP check in the above waterfall, one for the origin, the other for Google Analytics. Look at the effect this OCSP check has on the SSL negotiation time, as the SSL negotiation cannot complete until it receives a response from the OCSP responder. If you happen to use an EV certificate on your site, you should consider the web performance impact of this delay (especially on mobile connections). There's a lot to OCSP (including stapling) and I've written a little more about it here and here.
Third party overload
Another great use of the Connection View is to see how many third party requests a site is making. When you break a site load down by the number of connections, third parties have a huge impact on the number of connections required. For example, let's take a look at The Guardian website (for no particular reason, most online news sites suffer the same issue). How many third party requests can we see:
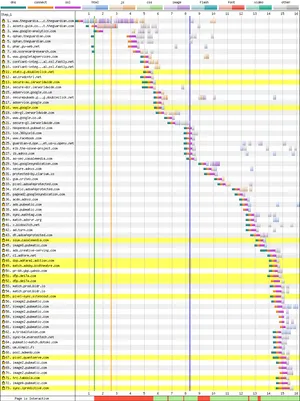
Here we see a grand total of 73 separate TCP connections that the browser is opening when visiting the homepage. It's quite clear to see the connection negotiations taking place on each row due to the very distinctive DNS + Connect + SSL colours. You could guess there's a lot of TCP connections using the Waterfall View, but it doesn't illustrate the point as well as the Connection view does.
Using the same method Andy Davies uses in his 'Measuring the Impact of 3rd-Party Tags With WebPageTest' blog post, we can easily block all third party requests and see what impact this has on the Connection View:
From a total of 73 connections in the Connection View, down to 5 when you block all the third party requests. That's a 93% reduction in the number of connections! If you've ever wondered why the web experience is bad on many mobile / low specification devices, here's a clear illustration why.
More to be added soon...
As I discover more common scenarios I will add them here. If you know of any common ones that are missing, please do let me know!
Conclusion
So there's a big brain dump of information about the WebPageTest Connection View, that should allow you to extract as much information for debugging web performance issues as possible. It's a really powerful view that can be used to spot many potential issues on its own, but when used in conjunction with the Waterfall View above it, it adds a whole new dimension to the test results.
As always, if there are any issues, errors, or anything I've missed please do let me know. I hope you've found it useful, and thanks for reading.
Post changelog:
- 30/12/19: Initial blog post published. Thanks Barry Pollard for the technical review and feedback.