WebPageTest comparison URL generator
As any reader of this blog will have noticed, in recent years I've taken a great interest in web performance both for my current job role and also as a hobby. And anyone interested in webperf will quickly realise that one of the best tools you can use to benchmark the performance of your website is WebPageTest. It's a tool that will give you a huge amount of information about how your website is performing, including useful data and charts that you can use to identify areas for improvement. Simply enter your URL, choose from a few settings and click 'Start Test'. I've written a lot more information on interpreting the results from these tests in my blog posts 'How to read a WebPageTest Waterfall View chart' and 'How to read a WebPageTest Connection View chart' for those interested in knowing more. But one of the most powerful features of WebPageTest is its ability to compare the results from multiple tests.
Measuring regressions and improvements
How do you know if you are improving a websites performance (or making it worse) if you can't easily compare results before and after you have made a change? This is where WebPageTest comes into its own. First: make sure you are logged in to your account (so your tests are saved), then run a number of tests. Next navigate to the 'Test history' page via the main menu. If you've run a number of tests you should see something similar to below.
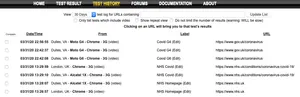
On this page the area we are interested in is to the left of the 'Date/Time' column (highlighted in red below). This section can be easy to miss since the form controls are quite small, but this is how you compare test results.
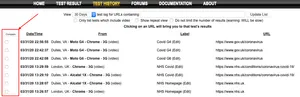
Simply select all the tests you would like to compare (you can select more than 2 if you wish), then click the 'Compare' button. WebPageTest will go away and the load a whole new view with a number of graphs and tools to help you gauge the performance difference between the tests that you have been selected (see below).
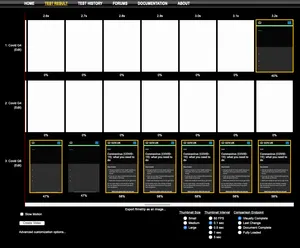
In the image above you can see a visual representation of how each of the pages loaded under the test conditions you chose. I won't go into the details here, but if you are interested in finding out more information about this view, I've written a little in this section from one of my previous blog posts.
How does this work
So under the hood, all the WebPageTest compare functionality is doing is creating a really long URL with a whole bunch of query parameters included. For example, above we selected 3 tests to compare, so the resulting URL contains three 42 character long test ID's within the tests parameter. This parameter driven functionality comes with two great advantages:
- Results for the specific comparison view can be bookmarked and very easily shared with anyone
- By manipulating the URL, you can change how the tests are rendered and compared on screen
Now point 2 sounds very useful, but it also comes with a caveat: WebPageTest URL's can be huge, making editing them manually quite a chore! When you consider each test ID is 42 characters long, and you include all of the advanced settings you can choose from, editing a URL in the browsers address bar probably isn't a feasible option. Also, mistakes are easy to make. Misplace the comma between test ID's or forget to URL encode your custom label names and you've got a broken page view on your hands.
WebPageTest comparison URL generator
The scenario I mention above I've personally struggled with too many times to count! So I recently decided to make my life a little easier and create a tool to do this URL manipulation for me. I've also published it online so others can use it if they so wish. It's available at https://wpt-compare.app/.
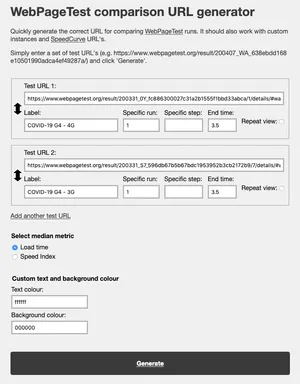
It really is quite a simple little application. All it is doing is building the long URL for you. But it comes with a few features that you may find useful:
- Ability to add as many test URLs as you need
- Drag / drop functionality to manipulate the order in which the tests appear
- Quickly select which median metric is used in the comparison
- Accepts multiple URL formats to extract the WebPageTest test ID's
- Compatible with SpeedCurve test URLs and custom instances
I've also included all the 'Advanced customization options' as seen in the modal that pops up after clicking 'Advanced customization options...' under the 'Create Video' button in the comparison view (see image above). These advanced settings include:
- Label: customise the label used to identify a specific test
- Specific run: Select a specific test run to use in the comparison view
- Repeat view: Compare the repeat view only, not the first view
- Specific step: If you are using scripting to navigate through a page journey, each page is considered a 'step'. So choose a specific step to compare. (Thanks Andy)
- Specific end time: Stop the comparison view at a specific number of seconds (e.g. 2.3 seconds)
- Background and text colour: I'm not sure if anyone uses this feature to customise the text and background colour of the page, but it's there if needed
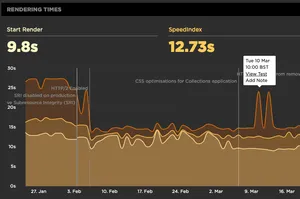
SpeedCurve URLs
As mentioned in the feature list above, SpeedCurve URLs are accepted by the tool too. You may (or may not) know that SpeedCurve runs WebPageTest instances under the hood to generate their synthetic test results that power the graphs. So if you happen to find a graph where there has been a large change between tests, you can either drill down into the results within SpeedCurve itself (click 'View Test' - see below), or you can look at them directly on the SpeedCurve WebPageTest instance. It's worth noting that the traditional 'Test history' functionality (mentioned earlier) is disabled on the SpeedCurve WebPageTest instances, probably due to the load on the servers it would create to list thousands of automated tests.
Now as we use SpeedCurve at GDS to monitor our services frontend performance, I find myself repeating this specific task a lot! So I added some helper functionality into the tool to allow me to quickly create the SpeedCurve specific comparison URLs. If you are a SpeedCurve user, why not give it a try.
Graph page data URL's
As of the 13th April 2021 I added the functionality to allow you to generate URL's for the 'Graph Page'. With this view you can generate a set of graphs and compare different sets of test runs under specific conditions. I've written a whole post about it that you can see here.
Feedback and feature requests
So there you have it: a simple tool to help you generate those huge WebPageTest comparison URLs for all your blogging and screenshotting needs! Hopefully you find it useful. If you do have any feedback, bugs, feature requests etc, please do reach out to me on Twitter.
Post changelog:
- 22/04/20: Initial post published.
- 13/04/21: Added information about using the tool for generating the graph page data view.