The web performance of internal systems is important, so optimise them too
A few weeks ago I had a really interesting chat with a service team from the Department for International Trade (DIT), who were interested in improving the web performance of one of their services. These are the conversations I really enjoy in my current job role. I get to speak about a subject I really enjoy, (virtually) meet new people, teach them a new skill they may not know much about, and the cherry on the top is the potential to improve a users experience of the service. Unfortunately my heart sank a little when they informed me that the service was internal facing and not publicly accessible to the web. This meant my usual goto tools for evaluating web performance weren't available. These are:
But that got me thinking, how can teams test their internal services and products? In this blog post I'm going to investigate this.
It's never been more important for fast internal systems
As everyone knows (I'd hope!) the whole world has changed due to a global pandemic. With lockdowns happening across the globe this has meant people have had to work from home (if they can). This fact has caused a measurable effect on internet performance across the globe, generally resulting in higher traffic and slower download times. Because of this, the digital tools workers rely on to do their jobs need to be quick to load and become interactive to user input.
Performance issues that may not have been a problem before because your internal user was at the office on the local area network (LAN) where the system is located, suddenly are big issues. What compounds this issue even further is that many people may live in rural areas with slow, unstable connections. Or maybe live on streets in major cities with high contention ratio connections. Being as we are talking about internal systems, you may even need to throw a virtual private network (VPN) into the mix just to be able to connect to your office network to use them. And as I'm sure any VPN user will know, they can sometimes have quite a negative effect on internet speed.
So now's a good time to remember that staff members are users too. Or if you want to convert that phrase into Government speak: "Civil servants are users too". So make sure you optimise your internal systems too, as slow website performance causes stress. But what tools can you use to do this, given that these internal systems may not be publicly available? Read on to find out.
WebPageTest
First thing I should clear up: when testing an internal system you won't be able to test using the public instance of WebPageTest. But what you can do is setup your own private instance of WebPageTest. That way you can have it sitting within your own internal network.
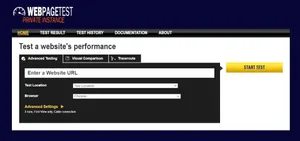
Once up and running you get access to a huge amount of data for all of your internal systems. And of course there are guides out there on how to extract as much info as you can out of WebPageTest. Setting up your own instance isn't as complicated as it sounds. There are a few excellent guides on how to do this for yourself on AWS in just a few minutes:
- WebPagetest Private Instances in Five Minutes - Patrick Meenan
- A Step by Step Guide to setting up an AutoScaling Private WebPageTest instance - Robin Osborne
- Private WebPageTest instances on AWS - Peter Hedenskog
- Configuring an ‘all-in-one' WebPageTest Private Instance - Andy Davies
What this also opens up for you is the ability to run WebPageTest periodically over time via automation. There are a few ways to do this:
- Falco - an Open Source WebPageTest runner
- Automating WebPageTest via the WebPageTest API - Robin Osborne
- WebPageTest Bulk Tester - Andy Davies
So as you make changes to the system you can see if that are making a positive (or negative) effect on performance.
Lighthouse
The next goto tool is one you probably have on your computer already, and that is Lighthouse by Google. If you have a copy of Google Chrome on your computer, then using Lighthouse to audit an internal system is dead simple:

In DevTools simply look for the 'Lighthouse' tab and click 'generate report'.

A minute of so later after the audit has run it will return a result like those in the image above. One thing I'd highly recommend when doing this is setting up a new Chrome profile specifically for Lighthouse testing, as browser extensions can have a huge negative performance impact on the result depending on what they are doing to the page.
But there's a lot more to Lighthouse than the audit panel. Here are just a few options available to you:
- You can run Lighthouse using the Command line interface (CLI)
- You can run Lighthouse across all pages of a site very easily
- Compare before and after performance results using Lighthouse CI Diff
- Automatically run Lighthouse at regular intervals across multiple sites using a test runner
- Add your own custom audits to monitor specific parts of a site
- Share results publicly via a Github Gist and the Lighthouse Report Viewer.
Sitespeed.io
I'm bumping Sitespeed.io up the list as I really don't think it gets enough love. It truly is a fantastic set of tools to improve your site's performance. It's also quick and easy to setup via a simple docker or npm command. It's easy to run on your local machine for quick testing, or can also be configured for continuous testing using AWS or Digital Ocean.
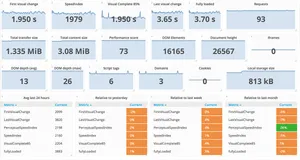
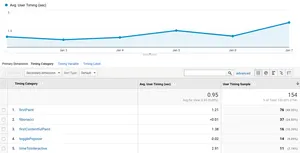
With sitespeed.io you can continuously monitor as many pages as you need and this data can then be pushed into Graphite/Grafana to give you dashboards like this. Under the hood, Sitespeed.io is actually a collection of tools all packaged together. These are:
- Coach - An automated tool that gives you advice on how to make your page faster.
- Browsertime - It's at the heart of the Sitespeed tools as it interacts with the test browsers (e.g. Chrome, Firefox, iOS Safari). It collects performance metrics, images, videos and much more.
- PageXray - Used for converting HTTP Archive format (HAR) files to JSON for easier reading and use. (There's more info on HAR files later in the post).
- Throttle - CLI tool for accurately throttling your network connection when performance testing. Note: it throttles the whole computer's connection, so remember to stop it when you've finished!
- Compare - An online tool so you can quickly and easily compare HAR files (e.g. before / after results).
Chrome DevTools
All modern browsers come with developer tools built in. We've come a long way since Firebug in Firefox! And these tools are becoming more and more powerful with every browser release. This is fantastic for developers, and ultimately end users too, since in theory websites should be less buggy right? (hah!).
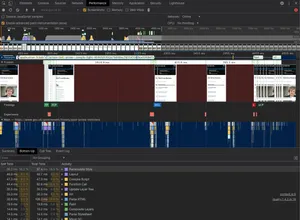
The above image shows you the detailed information that an audit in the 'Performance' tab can give you about the runtime performance of your web page. But there's so much more to Chrome DevTools than just the performance tab:
- The network tab gives you detailed information about all the requests (and responses back) in the browser.
- You can gather detailed information about memory usage including learning how to fix them.
- Look for unused CSS and JavaScript in a page using the 'Coverage' tab.
- There's actually an incredibly comprehensive post all about Performance Analysis in DevTools that covers many other aspects.
And if you are looking for non-Google articles on the subject, you can read:
- Profiling React performance with React 16 and Chrome Devtools - Ben Schwarz
- Debugging web performance with the Chrome DevTools Network tab - DebugBear
- Debugging JavaScript memory leaks using Chrome DevTools - DebugBear
Firefox DevTools
There are other browsers out there that can also help when it comes to evaluating performance issues via their DevTools. As a Firefox user, I use its developer tools every day. It too comes with a really comprehensive set of tabs you can use to look for site issues:
You can use the tools to:
- Identify and debug intensive JavaScript on the page.
- Easily visualise the types of assets on a page both with a cold and a warm cache.
- Inspect your site for Accessibility issues (Firefox has a great set of a11y tools).
Libraries for extending analytics data
This may not always be the case for internal tools, but if you are tracking their usage via some form of analytics (e.g. Google Analytics, Fathom, Matomo) you can extend the data captured to include more comprehensive web performance data.
There are a couple of libraries you can use to do this:
- Perfume.js - Can be configured to capture a large set of RUM data for pushing into an analytics tool.
- Analytics - Perfume.js plugin - Wrapper for Perfume.js to easily push web performance data into many different analytics tools.
- web-vitals - accurately capture Core Web Vitals information, as well as all other Web Vitals.
Perfume.js really stands out in the amount of Real User Monitoring (RUM) data it captures. It is fully configurable to capture as much, or as little data as you need. There are a few tutorials on how to do this here:
- First (Contentful) Paint with a touch of Perfume(.js) - Leonardo Zizzamia
- Time to Interactive with RUM - Leonardo Zizzamia
- Video: Improving site web performance with Perfume.js + Analytics - 19 mins
JavaScript analysis
I'm not here to comment on the use of JavaScript in an internal system, although I do believe you should minimise it's usage if you wish to improve its web performance and overall resilience. But assuming you are using it, then you should make sure it is as optimised as much as possible.
Thankfully there are a whole range of tools you can use to do this:
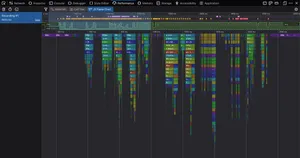
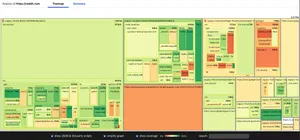
- bundle-wizard - CLI tool used to generate visualisations to see what a JavaScript bundle is made up of (see image above) so you can remove anything not needed.
- Bundle Phobia - Find the cost of what adding an npm package to your bundle would do.
- Webpack Bundle Analyzer - Visualize the internals of webpack output files with this tools interactive zoomable treemap.
- source-map-explorer - Use source maps to analyse JavaScript code bloat (this tool also works with Sass and LESS for CSS analysis).
Specific framework performance analysis tools and articles are also available:
- reactopt - A CLI React performance optimization tool that identifies potential unnecessary page re-rendering.
- TracerBench - a controlled performance benchmarking tool for web applications. Providing clear, actionable and usable insights into performance deltas.
- Measuring React app performance - DebugBear
CSS Analysis
As well as the 'Coverage' tab mentioned in Chrome DevTools earlier, there are also tools you can run via the CLI that will analyse your CSS, looking at its complexity as well as identifying unused selectors across a whole website:
- analyze-css - CSS selectors complexity and performance analyzer run using the CLI.
- uCSS - Crawl a whole site looking for unused CSS selectors that can be then removed.
Server benchmarking
Although the performance golden rule states that:
80-90% of the end-user response time is spent on the frontend.
It's still a good idea to make sure that the backend / server is optimised. After all Time to First Byte matters.
You also want to make sure that your server will be able to continue to function under load should that ever occur. There are a number of tools available to help you do both of these things:
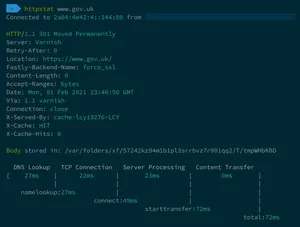
- httpstat - A small Python script to visualise the connection timing data returned from
curl(see image above). - h2load - A benchmarking tool for HTTP/2 and HTTP/1.1 run from the CLI.
- Hey - A tiny program for sending load to a server.
- k6 - Build realistic load tests by writing JavaScript. Comes with an API and CLI.
- Measuring Performance With Server Timing - Configure your server to send a header containing server timing information. Exposing backend server performance timings to the frontend so they can be easily observed in the browser.
Automation using Puppeteer
Puppeteer is a Node library which provides a high-level API to control Chrome or Chromium over the DevTools Protocol. Most things you can do manually in a browser can be replicated using Puppeteer, so how can this be leveraged to test web performance? Addy Osmani has blogged about using it for web performance testing and also shared the code on Github. These tests can be easily run via the CLI to test both internal and external websites.
Browser Extensions
There are a whole host of browser extensions you can use to evaluate web performance. When running these, I'd recommend using a separate profile with a minimal number of extensions enabled. This is because some browser extensions interact with the page and can slow down performance. Leading to skewed results. Extensions you can use are:
- sloth - An extension that slows down the CPU and network in the browser, allowing you to easily mimic page performance on slower devices.
- Perfmap - When used, the browser will create a heatmap of the resources loaded in the browser and their individual performance impact according to the Resource Timing API.
- Web Vitals Chrome Extension - Chrome extension that reports the core web vitals metrics (LCP, CLS, FID) for any page visited. Note: this is soon to be built into Chrome DevTools, and can currently be seen in Canary.
- perf-diagnostics.css - This isn't strictly a browser extension, it's a selection of CSS you can add to your page for debugging common performance issues. Simple and effective way to highlight images without a
width/heightattribute, among a number of others.
There are also extensions available to specifically help improve the performance when using certain JavaScript frameworks:
- React Developer Tools - This extension add a 'Profiler' tab to DevTools, allowing you to drill down into the performance of your React application.
- Angular Augury - A Chrome and Firefox extension that allows you to debug and profile Angular applications.
- Ember Inspector - Debug and dig into the detail of a web application built with Ember.
Network Throttling
Network throttling, as the name suggests this is a way to slow your network connection down. It's important to realise that many users won't have a fast (and stable) broadband connection in a major city. Many users could be in rural areas with poor broadband and very little mobile signal. By throttling your own network connection you get an idea of the performance of a site for users under these specific network conditions.
Now you may be asking: "Why would I throttle my network when Chrome Devtools has this built in?". Well it's important to realise that not all network throttling methods are created equally. When throttling using Chrome DevTools it applies a delay at the browser-level when each response is received. Lighthouse runs the test at full speed, then simulates the connection speed afterwards, sacrificing accuracy for reporting speed. The following tools are much more accurate. They use OS-level network throttling which works at a much lower level. Note: these tools below throttle the connection for the whole machine, so make sure you minimise the number of applications running when testing, and disable throttling once done!
I use throttle all the time as it's so simple to use:
# Enable 3G Slow
throttle 3gslow

# Use a custom connection profile
throttle --up 1600 --down 780 --rtt 250

# Disable throttle
throttle --stop
HAR file analysis
I mentioned HTTP Archive format (HAR) files earlier in the post. These files are a way of capturing a web browsers network interaction with a website. The great thing about these files is you can capture them for any site you can get to via your browser (internal or external). Capturing them is very simple in both Firefox and Chrome developer tools:
Firefox

Chrome
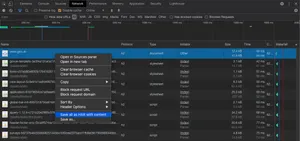
Once captured there are a bunch of different tools you can use to view and analyse them:
- HAR analyzer - In-browser HAR analysis tool from Google.
- YSlow Command Line HAR analyser - Very old now, but YSlow will analyse the HAR file looking for performance improvements.
- PageXray - Convert a HAR file to JSON so it is easier to read and interact with (used in Sitespeed.io).
- Compare - An online tool so you can quickly and easily compare HAR files (e.g. before / after results).
- HAR Viewer - Simple online HAR viewer to visualise the metrics within.
- Charles Proxy - HTTP proxy / HTTP monitor that can accept HAR files as input for detailed analysis.
- Fiddler - a debugging proxy server tool that can log, inspect, and alter traffic between a computer and a web server. It can also be used to analyse HAR files.
- Har2CSV - A CLI tool which provides an easy way to convert HAR file HTTP log entries into a flat CSV format to make it easier to analyze.
- Har2CSV & Har2TSV - My own version of the har2csv tool above but written with jq rather than node.
Web APIs
Going back to browser basics there are a few APIs you can use to measure the performance of a site if you want to do this yourself without using any abstraction libraries.
- performance.now() - The
now()method of the browser Performance interface returns a high resolution timestamp from when the method was called. Allowing you to measure the time between 2 calls very easily. Adding these before and after specific code will allow you to measure, and optimise this code. - Navigation Timing - This API allows developers to capture high resolution timing data related to the navigation of a document.
- Resource Timing - This API allows developers to collect complete timing information about the resources loaded by a document.
- Assessing Loading Performance in Real Life with Navigation and Resource Timing - Jeremy Wagner - A very comprehensive blog post all about how the two APIs listed above can be used to assess the loading performance of a web page.
Summary
Hopefully the resources listed above will give you the tools needed to improve your internal systems. Just because a service (or website) is only able to be accessed internally on a company network, doesn't mean that it can't be (and shouldn't be!) optimised for web performance. With so many people working remotely at the moment, don't assume that everyone has the luxury of a fast and stable connection. Because remember, you and your colleagues are users too!
As always, if you have any feedback about this post, or if I've missed anything please do let me know. Credit will be given in the changelog below.
Post changelog:
- 03/02/21: Initial post published.
- 03/03/21: Added 'Har2CSV' to HAR file analysis. Thanks to Paul Calvano for the link.
- 04/03/21: Added my version of 'Har2CSV' that uses jq.