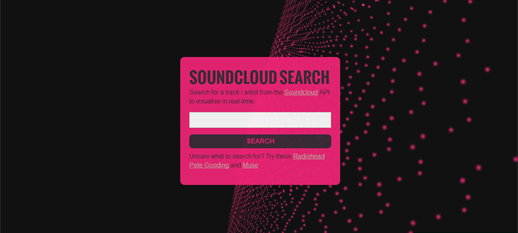
A visualisation experiment using SoundCloud, Backbone.js, three.js and node.js
Client work, as always, has been busy over the past month or so; so it’s always refreshing to have a play with something a little different. It’s even better when you can actually combine the two! Visual Jazz Isobar decided to have a little code competition open to all the developers in the company. The brief was very simple: build something cool using an external API (bonus points for multiple API’s). Very open brief don’t you think? You only have to have a look at the list of API’s available on programmable web to see that.
As I’ve recently been looking at Backbone.js I decided to put what I’ve learned good use. The experiment evolved over a couple of weeks. I originally planned to use d3.js and last.fm but eventually settled on three.js and SoundCloud. My final submission looked like this:

To be honest I could have built the experiment easily without using Backbone, but where is the challenge in that! I love the whole Model, View, Router set up. You do seem to be writing a lot of code a first for very little functionality, but once you are over the initial set up you can add features very quickly. I’ll definitely be using it again for future projects.
The visualisation itself makes use of the Web Audio API. The API is still being developed and standardized, because of that it only runs in Chrome at the moment. Three.js itself runs fine in Firefox, but no audio visualisation.
During development I stumbled across an issue with Chrome and the way the audio buffer works; for the data to load, the music files need to be on the same server as the application. This was a bit of a problem as I was using the SoundCloud API for music streaming. That’s where node.js and Nodester came to the rescue. With a little bit of node.js magic it’s fairly simple to create a proxy server and ‘bounce’ the stream from SoundCloud via the server to the visualisation. A big downside to this method is the music stream (mp3) has to be fully downloaded before the visualisation starts. For this reason only tracks under 6 minutes are returned as search results from SoundCloud. It’s not ideal but it work!
When the competition results came in I was placed second; not first but hey I learnt a lot in the process! Unfortunately a link to the live demo is no longer available.