Plotting Chaos
I've known about the Web Workers API (specifications) in Firefox 3.5+ for quite a while now but never had the chance to use it. With this little graphing project I saw it as the perfect opportunity to use it.
The Workers API allows you to 'spawn' worker threads underneath the main browser. The advantage of this is when the workers are doing heavy calculations the main browser window will still be responsive. Usually what happens is the heavy calculations are done by the browser thread, so the whole page and UI will freeze until the calculations are finished. Not at all good for the user.
There are limitations as to what the worker threads can do as they work within a sandbox. Worker threads can't manipulate the DOM directly; for DOM changes, a message must be sent back to the main thread. Luckily creating a worker thread and cross thread communication is simple:
//Create a worker thread
var worker = new Worker("js/worker.js");

//Send values to worker thread
worker.postMessage("My message here");

//Message received from the worker thread
worker.onmessage = function(e){
    //Grab all data and do something with it
    var dataBack = e.data;
}
The worker.js file will wait for a message from the main thread like so:
//Message from the window
function onmessage(e){
    //Do something with the data
    plotGraph(e.data);
}
The worker thread has now been created and messages can be passed back and forth as and when they are needed. You can think of a worker as a little math slave that's very good and number crunching but not much else.
You can view a live demo of the chaos graph here, it only works with Firefox 3.5+ at the moment due to it's dependencies on the Web Worker API.
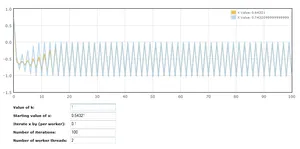
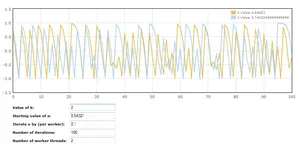
- Value of k: This sets the coefficient k, try changing this from 1 to 2, and any number in between and see what happens.
- Starting value of x: Self explanatory really, sets your initial x value before it is fed back into the equation.
- Iterate x by (per worker): This sets the difference in x value per worker thread. If this value equals 0.1, and your initial x value is 0.3, worker 2's inital x value equals 0.4, worker 3 = 0.5 and so on.
- Number of iterations: The number of times x is fed back into the equation. The bigger the number the longer it will take to calculate.
- Number of worker threads: Set how many worker threads you wish to run at the same time. Each worker will return a set of points from which a graph is plotted.
The Worker API is definitely something to look out for in the future, quicker and more efficient web apps here we come!