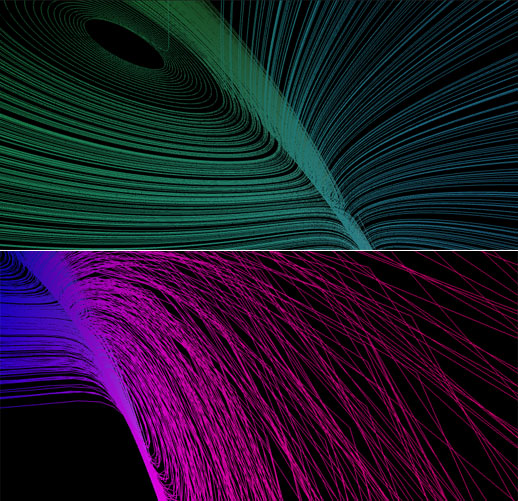
Plotting the Lorenz Attractor using three.js
It’s been a while since I dabbled with three.js. There have been a few API changes, so it’s slightly different from what I remember. That being said it’s still as fun to use, and there are even a few API docs available (not sure if they are fully up to date though)! I happened to be reading an article on Chaos Theory and the “butterfly effect” which mentioned a lovely set of equations; the Lorenz Equations, also known as the Lorenz oscillator. So I decided to investigate further. Here they are in all their glory:
So what exactly is the Lorenz oscillator? Well to quote from Wikipedia “The Lorenz oscillator is a 3-dimensional dynamical system that exhibits chaotic flow, noted for its figure eight shape.”. What this really boils down to is how even very small change in the equations initial conditions (x, y and z) causes large changes over time, in a complex and non-repeating pattern. There’s a famous title of a talk given in 1972 by Philip Merilees:
Does the flap of a butterfly’s wings in Brazil set off a tornado in Texas?
The butterfly flapping its wings introduces slight changes to the initial conditions, creating a chain of events that lead to a tornado in Texas. The Lorenz butterfly is a graphical way of showing these changes over time on a much smaller scale.
I’ve created a demo that allows you to change variables related to the Lorenz butterfly and observe the effect it has on the system.

There are a few variables you can play to change how the Lorenz attractor is rendered:
- rhoValue: Called the Rayleigh number. Rho of value 28 shows chaotic behavior. Other values show periodic orbits.
- showAxis: Allows you to turn the x, y, z (red, green, blue) axis on for reference.
- randomStart: Picks a random initial conditions, rather than 0, 0, 0.
- totalTime: The total time (or number of iterations performed) when generating the graph. Higher numbers equals more lines and increases the render time.
- timeIncriment: The accuracy of the graph depends on the number of points plotted. A lower number creates a smoother graph but increases render time.
- colorModifier: Simply changes the colo(u)r. Pointless but pretty!
While rendering a larger number of points, I noticed the browser lock-up for a second or so. This was because the points were being calculated on the browsers UI thread. Luckily modern browsers support thread like message passing in the form of the Web Workers API. By offloading the point calculation to its own thread (lorenzPoints.js), I was able to stop the nasty UI freeze. Unfortunately you are fairly limited with what you can pass back and forth between workers. It was possible to generate the three.js geometry in the worker thread thanks to the importScripts() method. I tried passing the three.js geometry back to the browser but all the methods were stripped out, leading to lots of errors (JSON issues). In the end I dropped back to calculating the points in the worker, pushing them into an array and generating the geometry on the main browser thread.
It was good fun dabbling with three.js, Web Workers and dat.gui again. Now on to my next project… View the demo here.